In this tutorial, we will explore how to create intelligent and multi-agent workflows using the API Mistral Agents transfer function. This allows different agents to work together by passing tasks to each other, which solves complex and effective complex problems. We are going to build a system where agents collaborate to answer questions related to inflation – efficient calculations, recover data online and create visualizations – to provide clear, precise and dynamic responses.
Step 1: Control of dependencies
Installation of libraries
pip install mistralai pydanticLoading the API Mistral key
You can get an API key from https://console.mistral.ai/api- Keys
from getpass import getpass
MISTRAL_API_KEY = getpass('Enter Mistral API Key: ')
Step 2: Agent prerequisite and configuration
Initialization of the agent
from mistralai import CompletionArgs, ResponseFormat, JSONSchema
from pydantic import BaseModel
from mistralai import Mistral

client = Mistral(MISTRAL_API_KEY)
Creation of the personalized function
The ADGL_Forflation function calculates the amount of a given money after taking into account inflation over time. It uses the formula composed according to the number of years and the annual inflation rate. If the end year is before the departure year, it returns an error. Otherwise, it returns the adjusted value with the input details. For example, ADGL_Forflation (1000, 1899, 2025, 10) shows what the value of 1000 ₹ from 1899 in 2025 to 10%.
def adjust_for_inflation(amount: float, start_year: int, end_year: int, annual_inflation_rate: float):
    """
    Calculates inflation-adjusted value using compound formula.
    """
    if end_year
Structured outing creation for mathematical reasoning
class CalcResult(BaseModel):
    reasoning: str
    result: str

inflation_tool = {
    "type": "function",
    "function": {
        "name": "adjust_for_inflation",
        "description": "Calculate the value of money adjusted for inflation over a time period.",
        "parameters": {
            "type": "object",
            "properties": {
                "amount": {
                    "type": "number",
                    "description": "Original amount of money"
                },
                "start_year": {
                    "type": "integer",
                    "description": "The starting year for inflation adjustment"
                },
                "end_year": {
                    "type": "integer",
                    "description": "The ending year for inflation adjustment"
                },
                "annual_inflation_rate": {
                    "type": "number",
                    "description": "Annual inflation rate in percent"
                }
            },
            "required": ("amount", "start_year", "end_year", "annual_inflation_rate")
        }
    }
}
Step 3: Creation of agents
Define the different agents
In this configuration, we define a multi-agent system using the API Mistral Agents to manage economic requests related to inflation. The main agent (economic agent) acts as a coordinator who sees tasks to specialized agents. The inflation agent performs inflation adjustment calculations using a personalized function. If the inflation rate lacks the request, the websearch agent recovers it on the internet. The calculator agent manages complex digital calculations with a step -by -step reasoning, while the graphic agent uses the code interpreter to view inflation trends over time. Together, these agents collaborate via transfers to offer precise and dynamic responses to economic requests.
# Main Agent
economics_agent = client.beta.agents.create(
    model="mistral-large-latest",
    name="economics-agent",
    description="Handles economic queries and delegates inflation calculations.",
)

# Inflation Function Agent
inflation_agent = client.beta.agents.create(
    model="mistral-large-latest",
    name="inflation-agent",
    description="Agent that calculates inflation-adjusted value using a custom function.",
    tools=(inflation_tool),
)

# Web Search Agent
websearch_agent = client.beta.agents.create(
    model="mistral-large-latest",
    name="websearch-agent",
    description="Agent that can search the internet for missing economic data such as inflation rates.",
    tools=({"type": "web_search"})
)


# Calculator Agent
from pydantic import BaseModel

class CalcResult(BaseModel):
    reasoning: str
    result: str

calculator_agent = client.beta.agents.create(
    model="mistral-large-latest",
    name="calculator-agent",
    description="Agent used to make detailed calculations.",
    instructions="When doing calculations, explain step by step.",
    completion_args=CompletionArgs(
        response_format=ResponseFormat(
            type="json_schema",
            json_schema=JSONSchema(
                name="calc_result",
                schema=CalcResult.model_json_schema(),
            )
        )
    )
)

# Graph Agent
graph_agent = client.beta.agents.create(
    model="mistral-large-latest",
    name="graph-agent",
    description="Agent that generates graphs using code interpreter.",
    instructions="Use code interpreter to draw inflation trends.",
    tools=({"type": "code_interpreter"})
)
Define transfers responsibilities
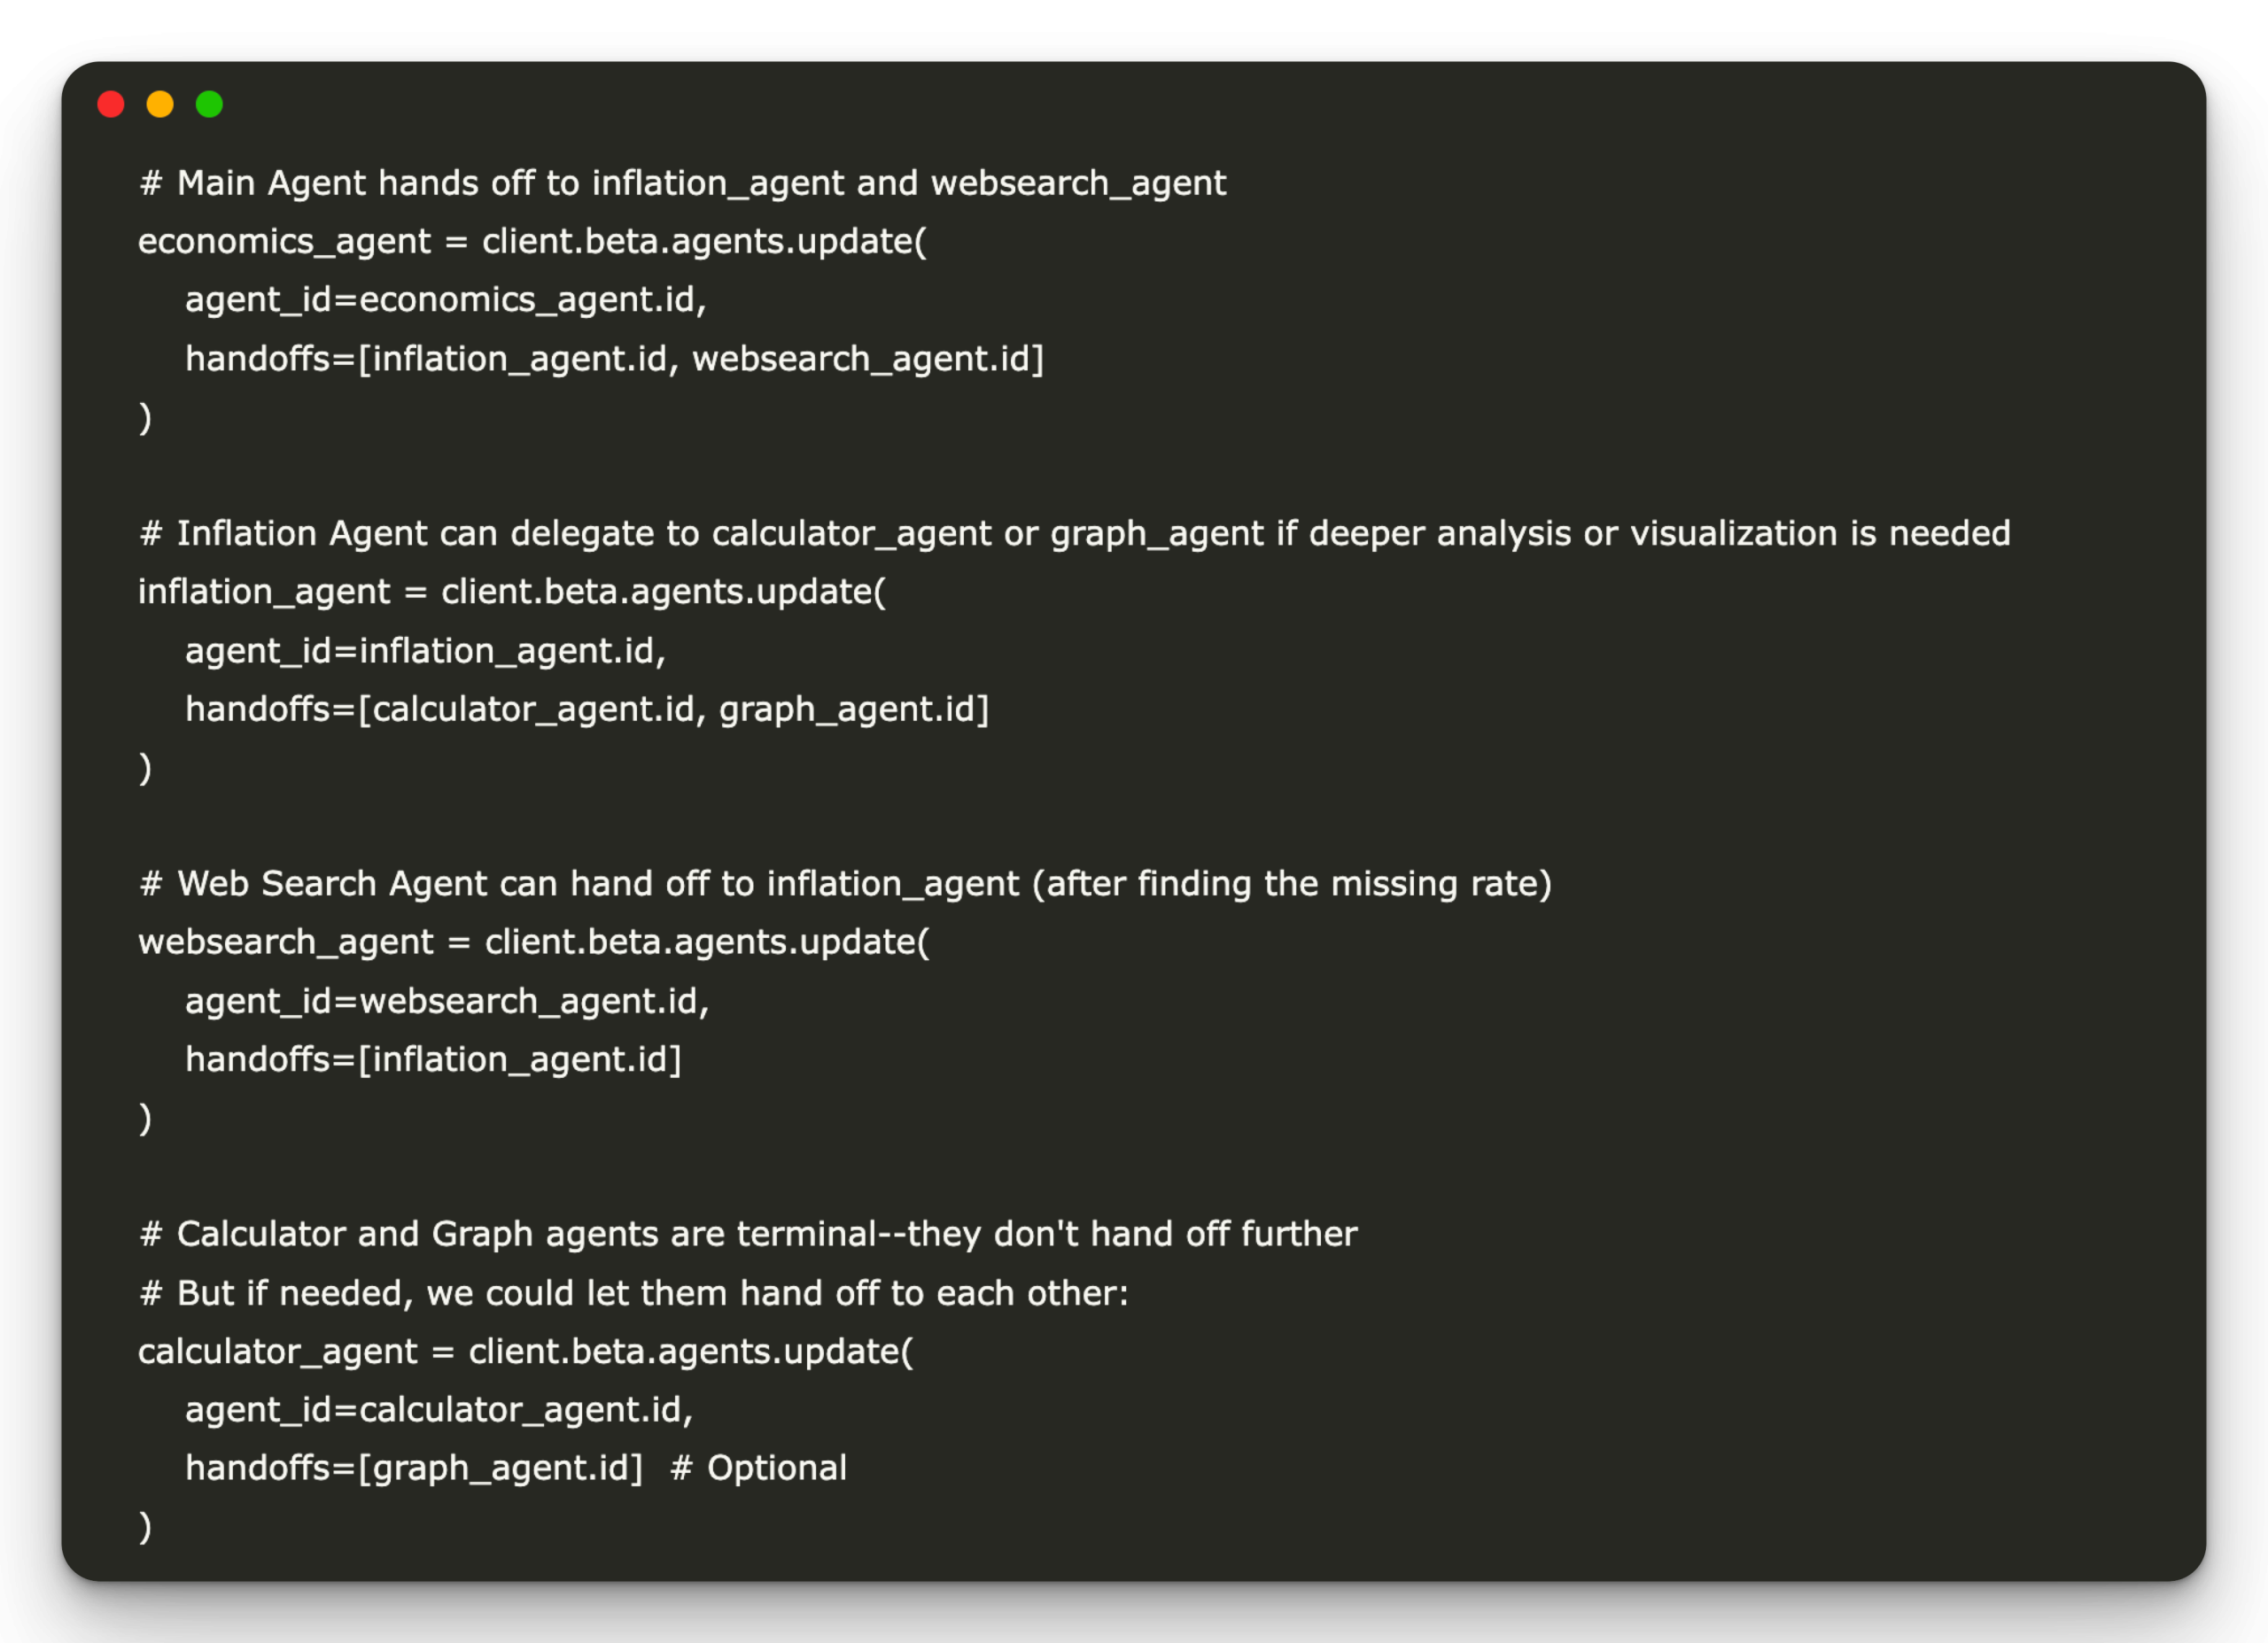
This configuration defines how agents delegate the tasks between us:
- The main agent (Economics_agent) serves as an entry point and delegates questions to inflation_agent (for inflation calculations) or websearch_agent (to recover missing data such as inflation rates).
- Inflation_agent, after having received the user request or data on the web, can further transmit tasks to the calculator_agent (for detailed mathematics) or graph_agent (to view trends).
- The websearch_agent can transmit control to inflation_agent after recovery of the required information, such as the inflation rate.
- Calculator_age and graph_agent are considered to be terminal agents. However, the optional mutual transfer is activated in the event that follows follow -up work (for example, graphically a calculated result or vice versa).
# Main Agent hands off to inflation_agent and websearch_agent
economics_agent = client.beta.agents.update(
    agent_id=economics_agent.id,
    handoffs=(inflation_agent.id, websearch_agent.id)
)

# Inflation Agent can delegate to calculator_agent or graph_agent if deeper analysis or visualization is needed
inflation_agent = client.beta.agents.update(
    agent_id=inflation_agent.id,
    handoffs=(calculator_agent.id, graph_agent.id)
)

# Web Search Agent can hand off to inflation_agent (after finding the missing rate)
websearch_agent = client.beta.agents.update(
    agent_id=websearch_agent.id,
    handoffs=(inflation_agent.id)
)

# Calculator and Graph agents are terminal--they don't hand off further
# But if needed, we could let them hand off to each other:
calculator_agent = client.beta.agents.update(
    agent_id=calculator_agent.id,
    handoffs=(graph_agent.id)  # Optional
)

graph_agent = client.beta.agents.update(
    agent_id=graph_agent.id,
    handoffs=(calculator_agent.id)  # Optional
)
Step 4: Execute the agent
Example A: What is the current inflation rate in India?
In this example, the invitation “What is the current inflation rate in India?” is transmitted to The Economics_agent, which is the main entry point to manage economic requests. Given that the question requires real -time data that is not included in the agent's static knowledge, The Economics_agent automatically restores the request for the websearch_agent, which is equipped with web search capacities.
prompt = "What is the current inflation rate in India?"
response = client.beta.conversations.start(
    agent_id=economics_agent.id,
    inputs=prompt
)
print(response.outputs(-1).content(0).text)
Example B: What is the adjusted value of inflation from 5,000 from 2010 to 2025 with an annual inflation rate of 6.5%. Explain the calculation steps and draw a graphic with data labels
This block of code sends the invitation to an economic agent, checks if the agent triggers a specific function call (adjustment_for_inflation), performs this function locally with the arguments provided, then returns the calculated result to the agent. Finally, he prints the agent's response, which includes the explanation of the calculation of inflation, as well as the Python code to trace the trend.
import json

from mistralai.models import FunctionResultEntry

prompt = """What is the inflation-adjusted value of 5,000 from the year 2010 to 2025 with annual inflation rate of 6.5%.
Explain calculation steps and plot a graph with data labels"""

response = client.beta.conversations.start(
    agent_id=economics_agent.id,
    inputs=prompt
)

# Check for function call
if response.outputs(-1).type == "function.call" and response.outputs(-1).name == "adjust_for_inflation":
    args = json.loads(response.outputs(-1).arguments)

    # Run local function
    function_result = json.dumps(adjust_for_inflation(**args))

    # Return result to Mistral
    result_entry = FunctionResultEntry(
        tool_call_id=response.outputs(-1).tool_call_id,
        result=function_result
    )

    response = client.beta.conversations.append(
        conversation_id=response.conversation_id,
        inputs=(result_entry)
    )

    print(response.outputs(-1).content)
else:
    print(response.outputs(-1).content)
The following code block was returned by the agent to draw the trend of the value adjusted by inflation over time.
import matplotlib.pyplot as plt
import numpy as np

# Parameters
original_amount = 5000
start_year = 2010
end_year = 2025
inflation_rate = 6.5 / 100  # Convert percentage to decimal

# Calculate the number of years
num_years = end_year - start_year + 1

# Calculate the adjusted value for each year
years = np.arange(start_year, end_year + 1)
adjusted_values = original_amount * (1 + inflation_rate) ** (years - start_year)

# Plot the graph
plt.figure(figsize=(10, 6))
plt.plot(years, adjusted_values, marker="o", linestyle="-", color="b")

# Add data labels
for year, value in zip(years, adjusted_values):
    plt.text(year, value, f'${value:.2f}', ha="right")

# Add titles and labels
plt.title('Inflation-Adjusted Value Over Time')
plt.xlabel('Year')
plt.ylabel('Adjusted Value')

# Save the plot as an image
plt.savefig('inflation_adjusted_value.png')

# Show the plot
plt.show()
Discover the Notebook. All the merit of this research goes to researchers in this project. Also, don't hesitate to follow us Twitter And don't forget to join our 98K + ML Subdreddit and subscribe to Our newsletter.

I graduated in Civil Engineering (2022) by Jamia Millia Islamia, New Delhi, and I have a great interest in data science, in particular neural networks and their application in various fields.
